WeBIM visualizes linked data on building projects
Constant changes in building projects challenges all parties of the building industry. A list of smart apps gives all parties a better overview and ensures better work processes through the entire building process.
We have developed a list of tools that makes it easier to gain an overview of the modifications in a building project.
The tools consists of some user friendly apps that each create coherence between the informations in a building model and makes them available in a visual and easily understandable way.
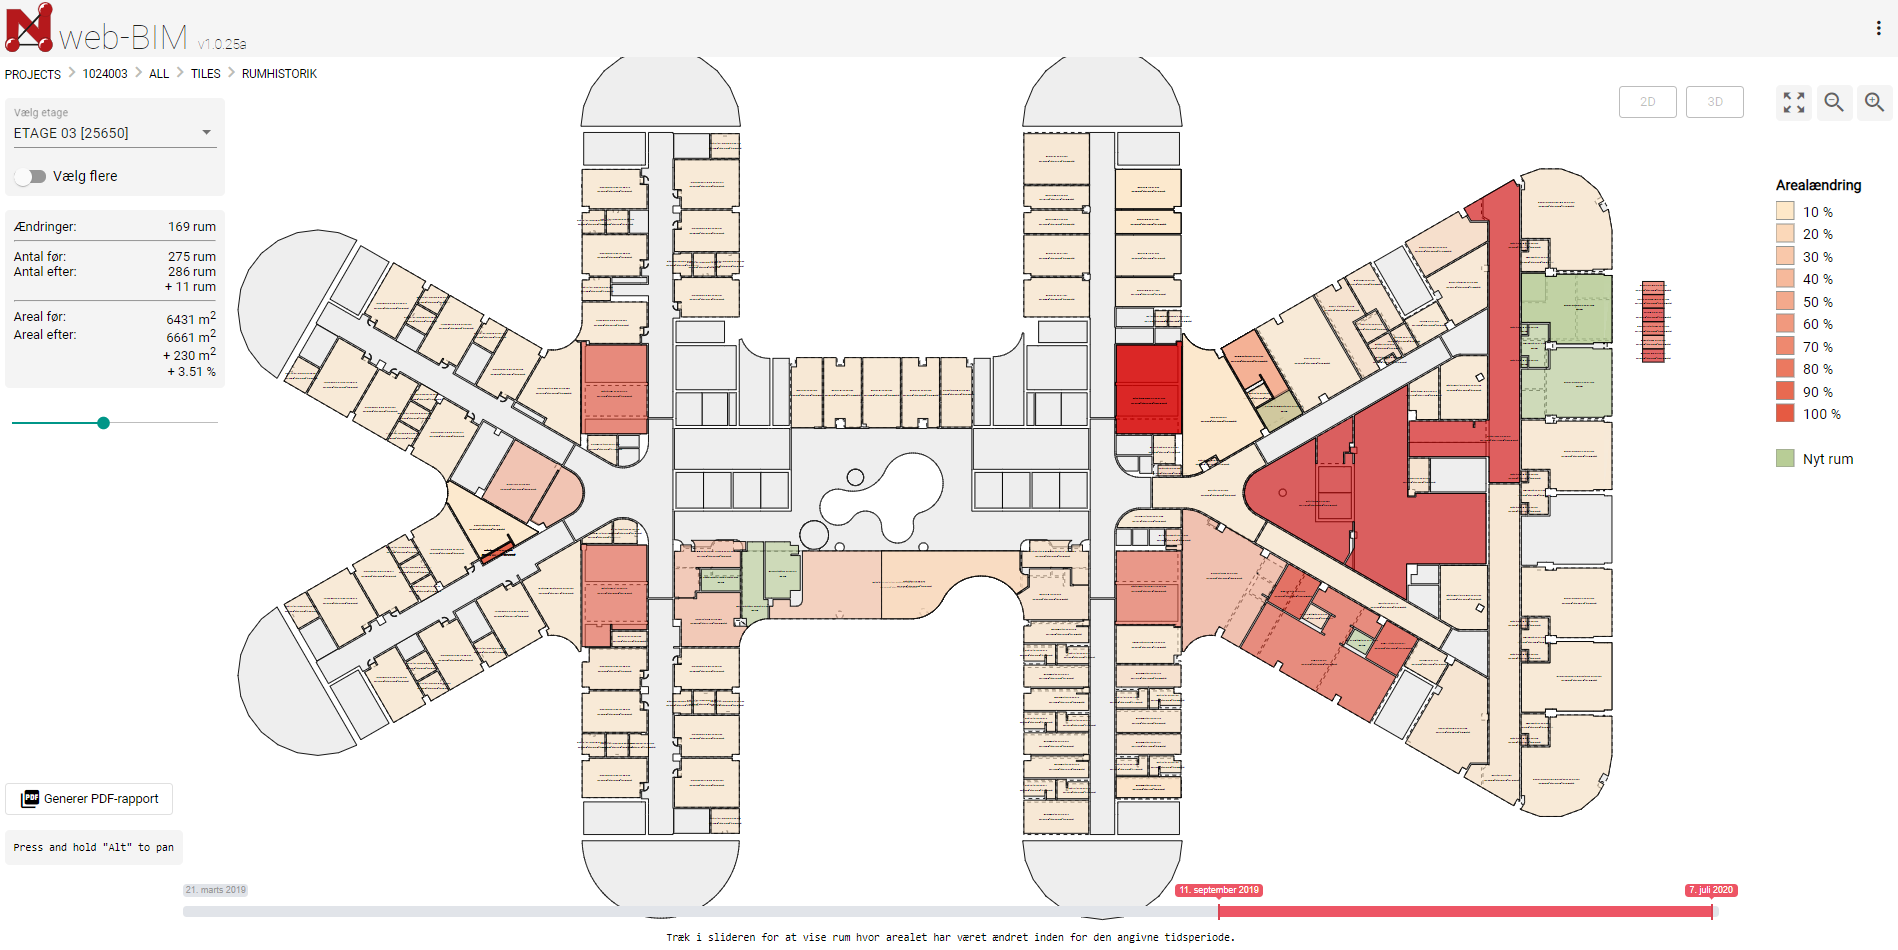
An example is an app that can show which rooms and construction parts that have changed form and placement within a given time period. Other apps create coherence between 3D-objects, construction lists, list of components, pump lists, charts, descriptions, offers, etc.
See the consequences of the modifications in the project
The many apps are gathered in a browser based ‘dashboard’ that keeps track and an overview of the projects development along the way. The tools create transparency for the building projects’ parties, which is important when you need to acknowledge the consequences of the modifications you make.
The apps’ are a part of an overall concept in NIRAS called WeBIM (Web-BIM), which builds on linked data-technology.
Enormous amounts of data is created both before, during and after a building project. In connection with working out the projects, different companies use a long list of digital tools to measure, simulate, describe, visualize, etc.
Even though the tools should process the same project material, the reality is unfortunately far more complex than that. Every tool uses an internal data model, that does not communicate with the data models from the other tools, which causes multiple parallel truths across tools.
Knowledge graph
With linked data we are capable of building a network of data, that has a relation in one way or another. It could be the employee who works on a list of projects or even the relation between the building’s floors, rooms and building parts.
A network of data like that is also known as a knowledge graph – a graph of knowledge, which you can search through to get an answer to your question.
When we have access to structured data, it is easier to integrate tools:
- With a standardized interface you can set up, modify and delete data of any application, where you have access to
- With a PowerBI you can make dashboards that shows key data in an easily accessible and interactive way
With apps (such as web-apps or Power-apps) we can build simple apps for e.g. registration assignments. In this way our data set is extended with new knowledge.